Tip of the Day 141: Using Cycle Values to Reduce Cursor Handling
I have observed that some customers spend time moving the Cycle Graph cursor around to find different values on the screen. It is true that you can find many useful numbers that way. But this requires you to access the eDART™ using the mouse, move it around and read some small numbers. Thus it requires some skill in hand-eye coordination and curve interpretation.
The Cycle Values window can display many of the values that people use the cursor to try to find. It displays them in a larger font easier to read from a distance. Furthermore it does not require that you precisely position the cursor, especially if one cursor pixel is too coarse to find the number.
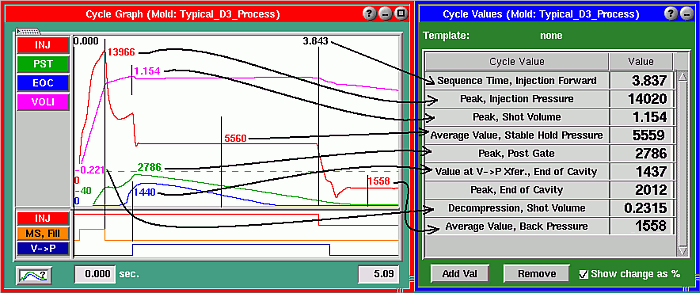
Here is a graphic that shows some common values that you can add to the Cycle Values instead of using the cursor.
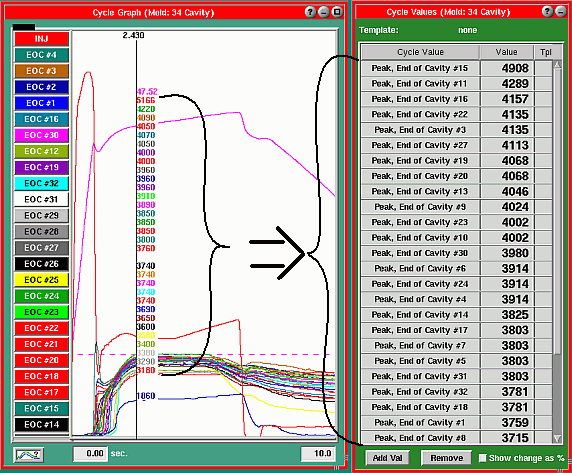
With many curves displayed we also hear questions about how we could annotate the cursor values or graphs on the cycle graph to make them easier to distinguish. Even if we put the labels on they are still hard to read.
Here is an example with 32 sensors for which we want to know the peak for each sensor. Placing the peaks on the Cycle Values can be easier than trying to read the values at the cursor for each.
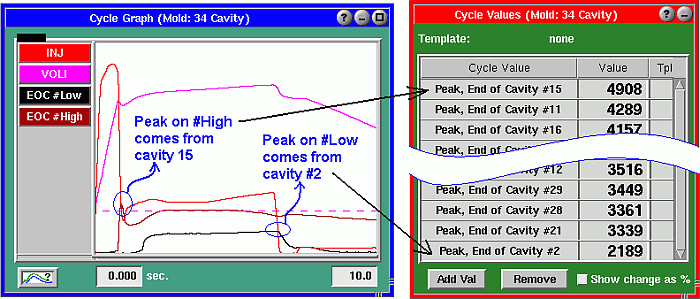
You can also keep the cycle graph up but just show the „#High“ and „#Low“ sensors and remove the rest (as in tip # 23 ). This gives you an „envelope“ to which you can match templates while the Cycle Values show you the curves that are pushing the envelope.

Per tip # 80, remember that once you have a long list of sensors on the Cycle Values a single click on the „Value“ header puts them all in value order. That way you can find the highest or lowest of reading quickly.
The eDART’s optional „Balance Viewer“ tool can simplify cavity-to-cavity comparison even further, especially for large numbers of sensors.
[youtube=UdEpaqtiqIE]

